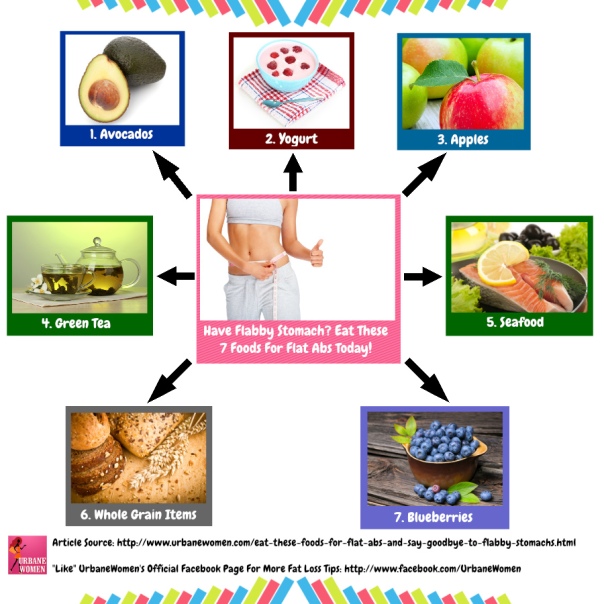
Image used by permission from UrbaneWomenMag
I don’t know when it started, but at some point in the last 5 or so years, people have really started to give up on fact checking. I mostly put the blame on the speed in which we receive our information. It used to be that we would read a newspaper or journal article, process it, discuss it, and then evaluate it on the merits of the content. Today, instead of newspapers, we have social media; instead of journal articles, we have infographics.
Ahhh, infographics. Those slick little data displaying, fun to share, fast-info representations of what used to be relevant data compressed into bite-sized chunks. Who cares where the material comes from, it looks AMAZING!
Of course I’m being a bit facetious and I have been known to use the odd infographic in my lesson, but I think I am pretty careful to weed out the visuals that blatantly misrepresent the truth. It isn’t always obvious, but with a little bit of sleuthing, anyone can separate the wheat from chafing (bad data use rubs me the wrong way). It was that very idea that started me on the journey to actually include MORE infographics in my classroom. Why not have the students critically analyze the data to see what has been carefully chosen, not added, or twisted in knots. Here is how I plan on going about this.
- Find a series of infographics that take a stance on an issue. There are some infographics which just take simple statistical data that don’t really choose one side or another, but those are rare. For the most part, there is an agenda that is being promoted either by the creator or the person who put the data together.
- Put students in small groups and have them discuss what you might need to know before analyzing an infographic or any other type of data (ex. Who made this? What information had been left out?). Have students share those ideas as a class and then make up a rubric based on that discussion.
- Give each group a different infographic and then have students scrutinize the data based on the rubric.
- Once they have explored the possible holes in the information, have students work on researching more information on this topic to help fill in those gaps.
- Have students post or present their findings and possibly follow that up with a blog post sharing their findings with the world.
I can see this helping EAP (academic English) students prepare for essay writing and discussions in university. It is a handy tool for anyone to follow and could possibly wake up others on social media to think twice about what they are sharing with others.

So many Facebook friends share infographics or similarly unqualified memes to note some riveting social situation, but provide no commentary on its reliability. Very frustrating, especially when I call them on it and am greeted with criticism about being overly suspicious.
That is where this actually started. I have gotten to the point of frustration with people who blindly share infographics without thinking where it came from. I thought it might be best to take out my frustration in a more productive manner. 🙂
That is such a good idea.I used to have an EAP lesson about reliability of statistics for the same critical thinking task but this never occurred to me.any good examples you’ve used?
Thanks for the comment. It’s funny, I don’t have any examples at the moment. I have run across so many bad infographics on Twitter and Facebook over time, but now when I want to find one, I can’t! Mind you, I actually haven’t looked that hard. This idea came to me the other day and I plan on using in my class soon. If you find any good (bad?) examples that I could use, let me know! I’ll look more seriously next week once I get through this ‘week off’ (translation: not at work, but super busy with everything else).
One article that has a few but I would need to think about how to use it as the misrepresented facts needed quite a lot of analysis by this author http://www.theatlantic.com/business/archive/2011/12/ending-the-infographic-plague/250474/
Great article! Shows how one needs to be vigilant is fact checking. These are probably a little too much for a classroom activity, but it does show how data can be twisted to fit one’s viewpoint. Thanks!
This has to be one surely! http://www.teachthemenglish.com/2013/10/favourite-infographic-for-october-what-are-the-hardest-languages-to-learn/ I need to think about it a bit first though